Otto Cycle – Otto Engine
In 1876, a German engineer, Nikolaus August Otto advanced the study of heat engines by building of the first working four-stroke engine. a stationary engine using a coal gas-air mixture for fuel. Wilhelm Maybach (1846-1929), one of the most important German engineers, perfected the construction, which was produced in large quantities already at the end of the year 1876. These inventions quickly reshaped the world in which they lived.
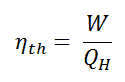
The cycle of the Otto engine is called the Otto cycle. It is the one of most common thermodynamic cycles that can be found in automobile engines and describes the functioning of a typical spark ignition piston engine. In contrast to Carnot cycle, the Otto cycle does not execute isothermal processes, because these must be performed very slowly. In an ideal Otto cycle, the system executing the cycle undergoes a series of four internally reversible processes: two isentropic (reversible adiabatic) processes alternated with two isochoric processes.
Since Carnot’s principle states that no engine can be more efficient than a reversible engine (a Carnot heat engine) operating between the same high temperature and low temperature reservoirs, the Otto engine it must have lower efficiency than the Carnot efficiency. A typical gasoline automotive engine operates at around 25% to 30% of thermal efficiency. About 70-75% is rejected as waste heat without being converted into useful work, i.e. work delivered to wheels.
Source: wikipedia.org, Own work of Zephyris, CC BY-SA 3.0
Otto Cycle – Processes
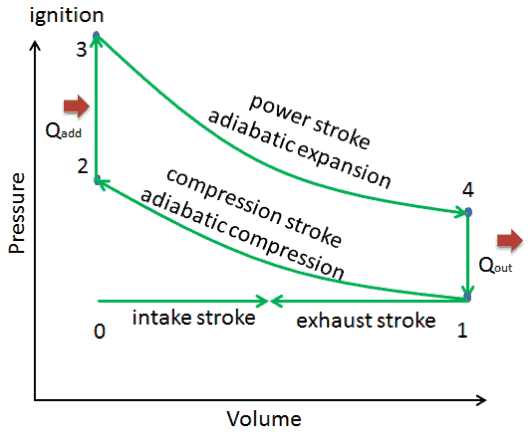
In an ideal Otto cycle, the system executing the cycle undergoes a series of four internally reversible processes: two isentropic (reversible adiabatic) processes alternated with two isochoric processes:
- Isentropic compression (compression stroke) – The gas (fuel-air mixture) is compressed adiabatically from state 1 to state 2, as the piston moves from bottom dead center to top dead center. The surroundings do work on the gas, increasing its internal energy (temperature) and compressing it. On the other hand the entropy remains unchanged. The changes in volumes and its the ratio (V1 / V2) is known as the compression ratio.
- Isochoric compression (ignition phase) – In this phase (between state 2 and state 3) there is a constant-volume (the piston is at rest ) heat transfer to the air from an external source while the piston is at rest at top dead center. This process is intended to represent the ignition of the fuel–air mixture injected into the chamber and the subsequent rapid burning. The pressure rises and the ratio (P3 / P2) is known as the “explosion ratio”.
- Isentropic expansion (power stroke) – The gas expands adiabatically from state 3 to state 4, as the piston moves from top dead center to bottom dead center. The gas does work on the surroundings (piston) and loses an amount of internal energy equal to the work that leaves the system. Again the entropy remains unchanged. The volume ratio (V4 / V3) is known as the isentropic expansion ration, but for Otto cycle, it is equal to the compression ratio.
- Isochoric decompression (exhaust stroke) – In this phase the cycle completes by a constant-volume process in which heat is rejected from the air while the piston is at bottom dead center. The working gas pressure drops instantaneously from point 4 to point 1. The exhaust valve opens at point 4. The exhaust stroke is directly after this decompression. As the piston moves from bottom dead center (point 1) to top dead center (point 0) with the exhaust valve opened, the gaseous mixture is vented to the atmosphere and the process starts anew.
During the Otto cycle, work is done on the gas by the piston between states 1 and 2 (isentropic compression). Work is done by the gas on the piston between stages 3 and 4 (isentropic expansion). The difference between the work done by the gas and the work done on the gas is the net work produced by the cycle and it corresponds to the area enclosed by the cycle curve. The work produced by the cycle times the rate of the cycle (cycles per second) is equal to the power produced by the Otto engine.
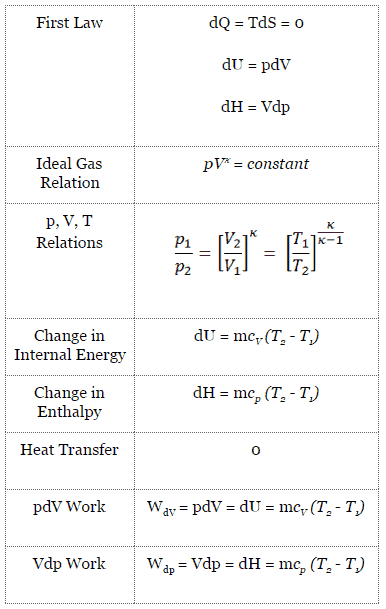
Isentropic Process
An isentropic process is a thermodynamic process, in which the entropy of the fluid or gas remains constant. It means the isentropic process is a special case of an adiabatic process in which there is no transfer of heat or matter. It is a reversible adiabatic process. The assumption of no heat transfer is very important, since we can use the adiabatic approximation only in very rapid processes.
Isentropic Process and the First Law
For a closed system, we can write the first law of thermodynamics in terms of enthalpy:
dH = dQ + Vdp
or
dH = TdS + Vdp
Isentropic process (dQ = 0):
dH = Vdp → W = H2 – H1 → H2 – H1 = Cp (T2 – T1) (for ideal gas)
Isentropic Process of the Ideal Gas
The isentropic process (a special case of adiabatic process) can be expressed with the ideal gas law as:
pVκ = constant
or
p1V1κ = p2V2κ
in which κ = cp/cv is the ratio of the specific heats (or heat capacities) for the gas. One for constant pressure (cp) and one for constant volume (cv). Note that, this ratio κ = cp/cv is a factor in determining the speed of sound in a gas and other adiabatic processes.
Isochoric Process
An isochoric process is a thermodynamic process, in which the volume of the closed system remains constant (V = const). It describes the behavior of gas inside the container, that cannot be deformed. Since the volume remains constant, the heat transfer into or out of the system does not the p∆V work, but only changes the internal energy (the temperature) of the system.
Isochoric Process and the First Law
The classical form of the first law of thermodynamics is the following equation:
dU = dQ – dW
In this equation dW is equal to dW = pdV and is known as the boundary work. Then:
dU = dQ – pdV
In isochoric process and the ideal gas, all of heat added to the system will be used to increase the internal energy.
Isochoric process (pdV = 0):
dU = dQ (for ideal gas)
dU = 0 = Q – W → W = Q (for ideal gas)
Isochoric Process of the Ideal Gas
The isochoric process can be expressed with the ideal gas law as:

or

On a p-V diagram, the process occurs along a horizontal line that has the equation V = constant.
See also: Guy-Lussac’s Law
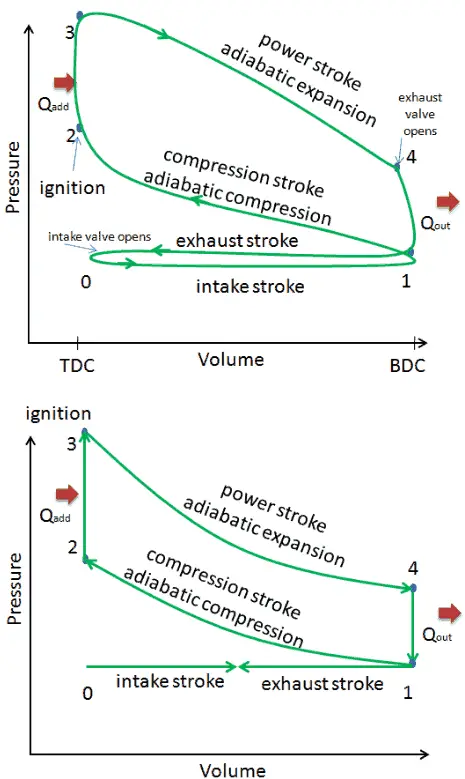
Otto Cycle – pV, Ts diagram
The Otto cycle is often plotted on a pressure- volume diagram (pV diagram) and on a temperature-entropy diagram (Ts diagram). When plotted on a pressure volume diagram, the isochoric processes follow the isochoric lines for the gas (the vertical lines), adiabatic processes move between these vertical lines and the area bounded by the complete cycle path represents the total work that can be done during one cycle.
The temperature-entropy diagram (Ts diagram) in which the thermodynamic state is specified by a point on a graph with specific entropy (s) as the horizontal axis and absolute temperature (T) as the vertical axis. Ts diagrams are a useful and common tool, particularly because it helps to visualize the heat transfer during a process. For reversible (ideal) processes, the area under the T-s curve of a process is the heat transferred to the system during that process.
Otto Cycle – Four Stroke Engine
The Otto cycle is a set of processes used by spark ignition internal combustion engines (two stroke or four stroke cycles). Nikolaus August Otto first designed what is known as the four stroke engine. A stroke refers to the full travel of the piston along the cylinder, in either direction. Therefore each does not correspond to single thermodynamic process given in chapter Otto Cycle – Processes.
The four stroke engine comprises:
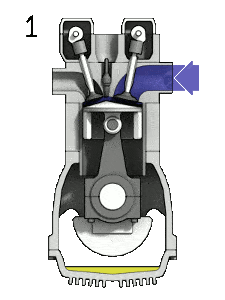
- the intake stroke – The piston moves from top dead center (TDC) to bottom dead center (BDC) and the cycle passes points 0 → 1. In this stroke the intake valve is open while the piston pulls an air-fuel mixture into the cylinder by producing vacuum pressure into the cylinder through its downward motion.
- the compression stroke – The piston moves from bottom dead center (BDC) to top dead center (TDC) and the cycle passes points 1 → 2 . In this stroke both the intake and exhaust valves are closed, therefore the fuel-air mixture is compressed. At the end of this stroke the fuel-air mixture is ignited by a spark, which causes further increase in pressure and temperature in the chamber. At the end of this stroke the crankshaft has completed a full 360 degree revolution.
- the power stroke – The piston moves from top dead center (TDC) to bottom dead center (BDC) and the cycle passes points 2 → 3 → 4. In this stroke both the intake and exhaust valves are closed. At the beginning of the power stroke, a spark ignites the fuel-air mixture in the combustion chamber, which in turn causes a very rapid combustion of the fuel. In this stroke the piston is driven towards the crankshaft, the volume in increased, and the pressure falls as work is done by the gas on the piston.
- the exhaust stroke. The piston moves from bottom dead center (BDC) to top dead center (TDC) and the cycle passes points 4 → 1 → 0. In this stroke the exhaust valve is open while the piston pulls an exhaust gases out of the chamber. At the end of this stroke the crankshaft has completed a second full 360 degree revolution.
Comparison of Actual and Ideal Otto Cycles
- Closed cycle. The largest difference between the two diagrams is the simplification of the intake and exhaust strokes in the ideal cycle. In the exhaust stroke, heat Qout is ejected to the environment, in a real engine, the gas leaves the engine and is replaced by a new mixture of air and fuel.
- Instantaneous heat addition (isochoric heat addition). In real engines the heat addition is not instantaneous, therefore the peak pressure is not at TDC, but just after TDC.
- No heat transfer (adiabatic)
- Compression – The gas (fuel-air mixture) is compressed adiabatically from state 1 to state 2. In real engines, there are always some inefficiencies that reduce the thermal efficiency.
- Expansion. The gas (fuel-air mixture) expands adiabatically from state 3 to state 4.
- Complete combustion of fuel-air mixture.
- No pumping work. Pumping work is the difference between the work done during exhaust stroke and the work done during intake stroke. In real cycles, there is a pressure difference between exhaust and inlet pressures.
- No blowdown loss. Blowdown loss is caused by the early opening of exhaust valves. This results in a loss of work output during expansion stroke.
- No blow-by loss. The blow-by loss is caused by the leakage of compressed gases through piston rings and other crevices.
- No frictional losses.
These simplifying assumptions and losses lead to the fact that the enclosed area (work) of the pV diagram for an actual engine is significantly smaller than the size of the area (work) enclosed by the pV diagram of the ideal cycle. In other words, the ideal engine cycle will overestimate the net work and, if the engines run at the same speed, greater power produced by the actual engine by around 20%.
Compression Ratio – Otto Engine
The compression ratio, CR, is defined as the ratio of the volume at bottom dead center and the volume at top dead center. It is a key characteristics for many internal combustion engines. In the following section, it will be shown that the compression ratio determines the thermal efficiency of used thermodynamic cycle of the combustion engine. In general, it is desired to have a high compression ratio, because it allows an engine to reach higher thermal efficiency.
For example, let assume an Otto cycle with compression ratio of CR = 10 : 1. The volume of the chamber is 500 cm³ = 500×10-6 m3 (0.5l) prior to the compression stroke. For this engine all required volumes are known:
- V1 = V4 = Vmax = 500×10-6 m3 (0.5l)
- V2 = V3 = Vmin = Vmax / CR = 55.56 ×10⁻⁶ m3
Note that (Vmax – Vmin) x number of cylinders = total engine displacement.
Examples of Compression Ratios – Gasoline vs. Diesel
- The compression ratio in a gasoline-powered engine will usually not be much higher than 10:1 due to potential engine knocking (autoignition) and not lower than 6:1.
- A turbocharged Subaru Impreza WRX has a compression ratio of 8.0:1. In general, a turbocharged or supercharged engines already have compressed air at air intake, therefore they are usually built with lower compression ratio.
- A stock Honda S2000 engine (F22C1) has a compression ratio of 11.1:1.
- Some atmospheric sportscar engines can have compression ratio up to 12.5 : 1 (e.g. Ferrari 458 Italia).
- In 2012, Mazda released new petrol engines under the brand name SkyActiv with a 14:1 compression ratio. To reduce the risk of engine knocking, residual gas is reduced by using 4-2-1 engine exhaust systems, implementing a piston cavity, and optimizing fuel injection.
- The Diesel engines have the compression ratio that normally exceed 14:1 and ratios over 22:1 are also common.
Thermal Efficiency for Otto Cycle
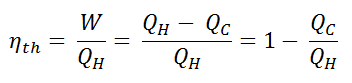
In general the thermal efficiency, ηth, of any heat engine is defined as the ratio of the work it does, W, to the heat input at the high temperature, QH.
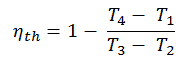
The thermal efficiency, ηth, represents the fraction of heat, QH, that is converted to work. Since energy is conserved according to the first law of thermodynamics and energy cannot be be converted to work completely, the heat input, QH, must equal the work done, W, plus the heat that must be dissipated as waste heat QC into the environment. Therefore we can rewrite the formula for thermal efficiency as:
The heat absorbed occurs during combustion of fuel-air mixture, when the spark occurs, roughly at constant volume. Since during an isochoric process there is no work done by or on the system, the first law of thermodynamics dictates ∆U = ∆Q. Therefore the heat added and rejected are given by:
Qadd = mcv (T3 – T2)
Qout = mcv (T4 – T1)
Substituting these expressions for the heat added and rejected in the expression for thermal efficiency yields:
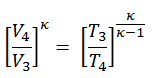
We can simplify the above expression using the fact that the processes 1 → 2 and from 3 → 4 are adiabatic and for an adiabatic process the following p,V,T formula is valid:
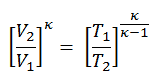
It can be derived that:
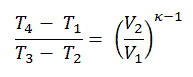
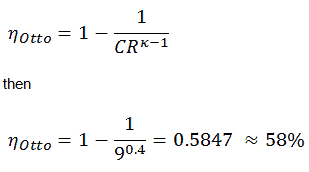
In this equation, the ratio V1/V2 is known as the compression ratio, CR. When we rewrite the expression for thermal efficiency using the compression ratio, we conclude the air-standard Otto cycle thermal efficiency is a function of compression ratio and κ = cp/cv.
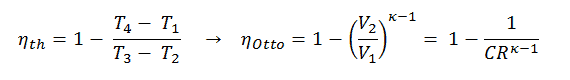
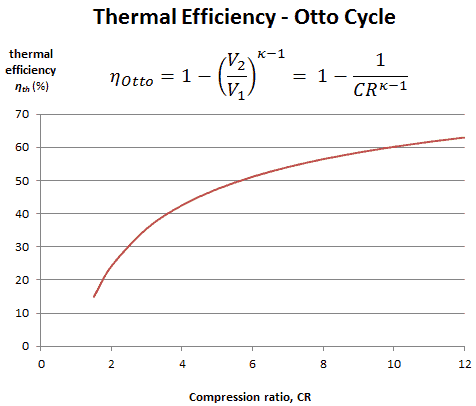
It is very useful conclusion, because it is desirable to achieve a high compression ratio to extract more mechanical energy from a given mass of air-fuel mixture. A higher compression ratio permit the same combustion temperature to be reached with less fuel, while giving a longer expansion cycle. This creates more mechanical power output and lowers the exhaust temperature. Lowering the exhaust temperature causes the lowering of the energy rejected to the atmosphere. This relationship is shown in the figure for κ = 1.4, representing ambient air.
Autoignition – Limit for Compression Ratio
In an ordinary gasoline engines the compression ratio has its limits. The compression ratio in a gasoline-powered engine will usually not be much higher than 10:1 due to potential engine knocking (autoignition) and not lower than 6:1. Higher compression ratios will however make gasoline engines subject to engine knocking, caused by autoignition an unburned mixture, if lower octane-rated fuel is used. The unburned mixture may autoignite by detonating from pressure and heat alone, rather than ignite from the spark plug at exactly the right time. The engine knocking can be reduced by using high-octane fuel, which increases the gasoline’s resistance to autoignition. The higher the octane number, the more compression the fuel can withstand before detonating (igniting). Since the temperature attained by the fuel-air mixture during the compression increases as the compression ratio increases, the likelihood of autoignition increases with the compression ratio. The autoignition can reduce efficiency or damage the engine if knock sensors are not present to modify the ignition timing.
Higher compression ratios can be achieved in diesel engines (also referred to as compression-ignition engines), because they do not compress the fuel, but rather compress only air and then inject fuel into the air which was heated by compression. Compression ratios in the range of 12 to 20 are typical for diesel engines. The the greater expansion in diesel engines means they reject less heat in their cooler exhaust. The higher compression ratio (greater expansion) and the higher peak temperature causes that diesel engines reach higher thermal efficiency.
Mean Effective Pressure – MEP
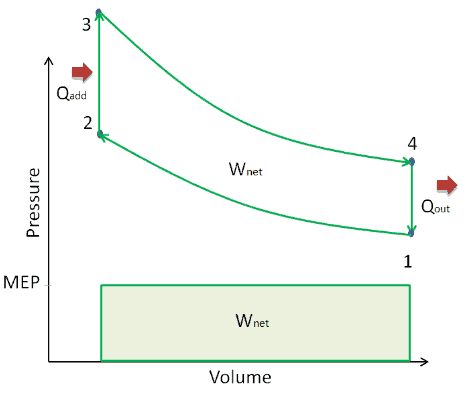
A parameter used by engineers to describe the performance of reciprocating piston engines is known as the mean effective pressure, or MEP. MEP is a very useful measure of an engine’s capacity to do work that is independent of engine displacement. There are several types of MEP. These MEPs are defined by the location measurement and method of calculation (e.g. BMEP or IMEP).
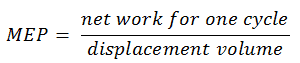
In general, the mean effective pressure is the theoretical constant pressure that, if it acted on the piston during the power stroke, would produce the same net work as actually developed in one complete cycle. The MEP can be defined as:
For example, the net indicated mean effective pressure, known as IMEPn is equal to the mean effective pressure calculated from in-cylinder pressure (there must be this measurement) over the complete engine cycle. Note that, it is 720° for a four-stroke engine and 360° for a two-stroke engine.
Some examples:
- MEP of an atmospheric gasoline engine can range from 8 to 11 bar in the region of maximum torque.
- MEP of a turbocharged gasoline engine can range from 12 to 17 bar.
- MEP of an atmospheric diesel engine can range from 7 to 9 bar.
- MEP of a turbocharged diesel engine can range from 14 to 18 bar
For example, a four-stroke gasoline engine producing 200 N·m from 2 litres of displacement has a MEP of (4π)(200 N·m)/(0.002 m³) = 1256000 Pa = 12 bar. As can be seen, the MEP is useful characteristics of an engine. For two engines of equal displacement volume, the one with a higher MEP would produce the greater net work and, if the engines run at the same speed, greater power.
Otto Cycle – Problem with Solution
Let assume the Otto cycle, which is the one of most common thermodynamic cycles that can be found in automobile engines. One of key parameters of such engines is the change in volumes between top dead center (TDC) to bottom dead center (BDC). The ratio of these volumes (V1 / V2) is known as the compression ratio.
The compression ratio in a gasoline-powered engine will usually not be much higher than 10:1 due to potential engine knocking (autoignition) and not lower than 6:1. For example, some sportscar engines can have compression ratio up to 12.5 : 1 (e.g. Ferrari 458 Italia).
In this example let assume an Otto cycle with compression ratio of CR = 9 : 1. The intake air is at 100 kPa = 1 bar, 20 °C, and the volume of the chamber is 500 cm³ prior to the compression stroke. The temperature at the end of adiabatic expansion is T4 = 800 K.
- Specific heat capacity at constant pressure of air at atmospheric pressure and room temperature: cp = 1.01 kJ/kgK.
- Specific heat capacity at constant volume of air at atmospheric pressure and room temperature: cv = 0.718 kJ/kgK.
- κ = cp/cv = 1.4
Calculate:
- the mass of intake air
- the temperature T3
- the pressure p3
- the amount of heat added by burning of fuel-air mixture
- the thermal efficiency of this cycle
- the MEP
Solution:
1) the mass of intake air
At the beginning of calculations we have to determine the amount of gas in the cylinder before the compression stroke. Using the ideal gas law, we can find the mass:
pV = mRspecificT
where:
- p is the absolute pressure of the gas
- m is the mass of substance
- T is the absolute temperature
- V is the volume
- Rspecific is the specific gas constant, equal to the universal gas constant divided by the molar mass (M) of the gas or mixture. For dry air Rspecific = 287.1 J.kg-1.K-1.
therefore
m = p1V1/RspecificT1 = (100000 × 500×10-6 )/(287.1 × 293) = 5.95×10⁻⁴ kg
In this problem all volumes are known:
- V1 = V4 = Vmax = 500×10-6 m3 (0.5l)
- V2 = V3 = Vmin = Vmax / CR = 55.56 ×10⁻⁶ m3
Note that (Vmax – Vmin) x number of cylinders = total engine displacement.
2) the temperature T3
Since the process is adiabatic, we can use the following p, V, T relation for adiabatic processes:
thus
T3 = T4 . CRκ – 1 = 800 . 90.4 = 1926 K
3) the pressure p3
Again, we can use the ideal gas law to find the pressure at the beginning of the power stroke as:
p3 = mRspecificT3 / V3 = 5.95×10-4 x 287.1 x 1926 / 55.56 ×10-6 = 5920000 Pa = 59.2 bar
4) the amount of heat added
To calculate the amount of heat added by burning of fuel-air mixture, Qadd, we have to use the first law of thermodynamics for isochoric process, which states the Qadd = ∆U, therefore:
Qadd = mcv (T3 – T2)
the temperature at the end of the compression stroke can be determined using the p, V, T relation for adiabatic processes between points 1 → 2.
T2 = T1 . CRκ – 1 = 293 . 90.4 = 706 K
then
Qadd = mcv (T3 – T2) = 5.95×10-4 x 718 x 1220 = 521.2 J
5) the thermal efficiency
Thermal efficiency for an Otto cycle:
As was derived in the previous section, the thermal efficiency of an Otto cycle is a function of compression ratio and κ:
6) the mean effective pressure
The MEP was defined as:
It this equation the displacement volume is equal to Vmax – Vmin. The net work for one cycle can be calculated using the heat added and the thermal efficiency:
Wnet = Qadd . ηOtto = 521.2 x 0.5847 = 304.7 J
MEP = 304.7 / (500×10-6 – 55.56 ×10⁻⁶) = 685.6 kPa = 6.856 bar
We hope, this article, Otto Cycle – Otto Engine, helps you. If so, give us a like in the sidebar. Main purpose of this website is to help the public to learn some interesting and important information about thermal engineering.